
Data analytics is a powerful tool for organisations. Below you will find some examples of projects we have undertaken with a variety of organisations using analysis of internal and external data to drive better decision making.
Fast Cars


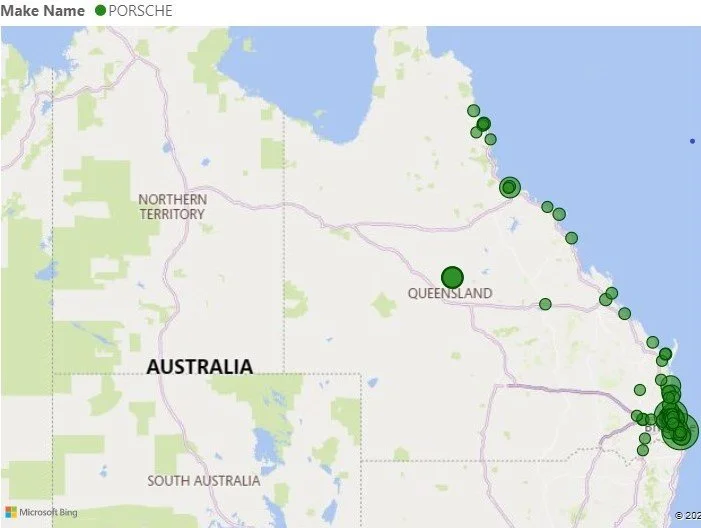
We worked with a car brand to help them understand what the market for sports cars looked like over the prior 12 months compared with cars in general, and where people had been buying the types of cars they sold.
Hospitality


Over time room service sales in hotels have been decreasing, particularly amongst non-business travelers. A hotel group partnered with a famous chef to create a new line of room service meals to replace their old menu. The challenge was to identify the best methods of advertising this new menu to guests while understanding the impact of each advertising channel on its own and in combination with the other channels.
We found significant increases in sales could be achieved by informing guests about the new menu at check-in, followed by exposing guests to advertising for the new menu on posters in the lifts, and finally placing additional material about the new menu in their room. Of the three channels, the most effective by itself and in combination with other channels was providing information about the new menu during check-in.
Advertising


If you are running advertising, you need to know you are getting value for money. This means knowing your return on investment (ROI). We tested the ROI of advertising targeting key locations around Australia for a business. Not surprisingly, the sales and ROI were largely correlated with population; the more people in an area the more people that saw the advertising and bought. However, by controlling for population, it was possible to identify where the ROI per capita was above the baseline ROI. This helped to identify key markets for this business and optimize advertising allocation.
Volunteers

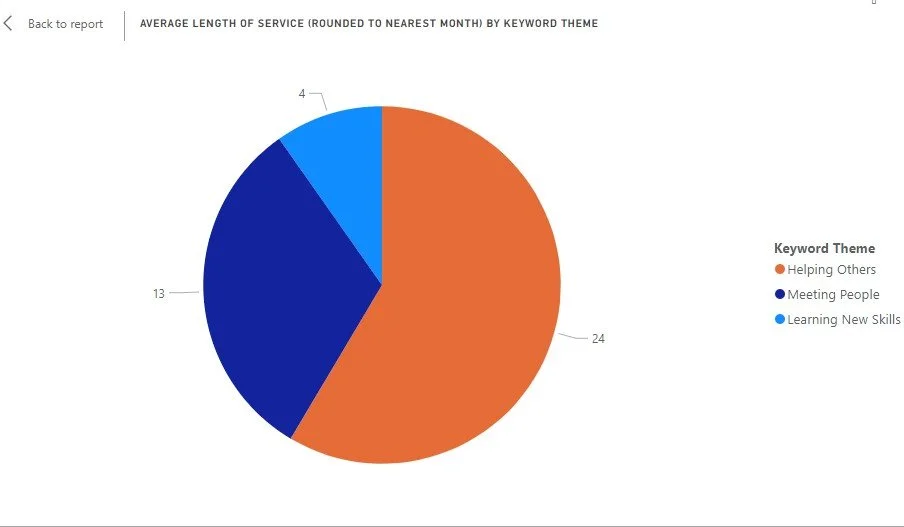

Not for profits put a lot of effort, and money, into attracting volunteers. This means it’s important to understand what attracts volunteers and to also understand what to expect from different types of volunteers. This organisation ran regular advertising seeking to attract volunteers using keywords that could be grouped under three main themes: helping others, learning new skills, meeting people.
We found that the largest group of volunteers were attracted to keywords relating to learning new skills, followed by meeting people and then helping others. However, when we analysed how long a volunteer was likely to stay based on the keyword theme that attracted them in the first place, we found the results were not only reversed, a volunteer attracted by keywords related to helping others was likely to stay much longer than a volunteer attracted by keywords related to learning new skills.
This information helped the organisation to optimise its advertising spend when attracting new volunteers and is also a classic example of quality over quantity!
Client Profitability


All businesses want to look after their most profitable clients, but in service businesses there is often ambiguity around who the most profitable clients are. This is particularly true in service businesses that charge an agreed monthly fee for an agreed amount of work. This includes everything from Property Managers to Commercial Cleaning Companies to SEO Consultants.
The difficulty is, as all business owners know, some clients are more demanding than others. For example, a commercial cleaning company might have a shopping center client that pays their bills on time every month with very little contact, and another shopping center client that calls every other day demanding a cleaning crew come back out to re-polish a surface that isn’t shinny enough. When you calculate the unbilled cost of servicing fixed price clients, often you may be surprised by which clients are actually the most profitable.
The data above is from a project that we undertook as a pilot study in the regional office of a commercial cleaning company. The office already had the monthly gross and net profit figures for each client. Over a period of several months, we worked with them to capture the additional unbilled costs associated with servicing each client. Everything from the value of time spent by staff taking phone calls from unhappy facility managers to consumables used for rework.
As the data shows, these unbilled costs can really make a difference. Factoring in these hidden costs caused the profitability rankings to change and two of the smaller clients were actually costing the business money to keep as clients!
More Advertising


Data analytics is really useful for understanding what is happening in a business, but often its true value is in its predictive ability.
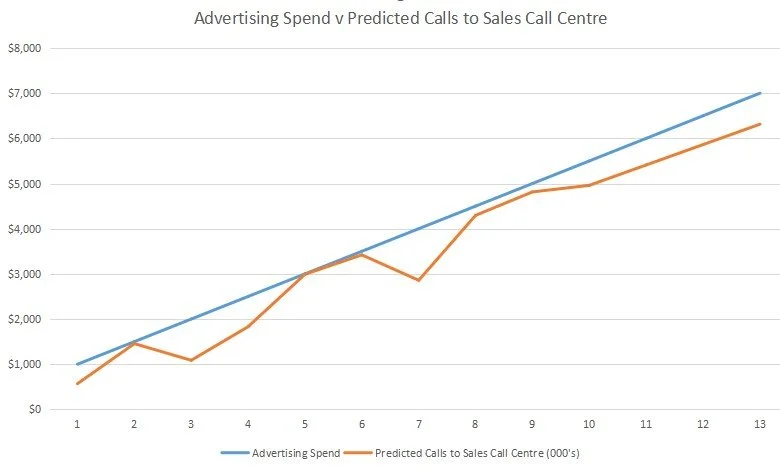
We worked on a project with an American business that sold a range of products via inbound calls to a call center. These calls were driven by advertising through a range of channels in key target markets. Both the marketing manager and the sales call center manager were interested in understanding how advertising spend impacted on calls to the call center so we developed a data analytics project to understand the relationship between advertising dollars spent and calls received.
The first thing we did was had a specific phone number allocated to an advertising campaign, then we set the advertising spend at $1000 and tracked how many calls this generated. We stepped the advertising spend up in $500 increments while tracking calls generated. When we had reached $5000 we were able to demonstrate a clear linear relationship between money spent on advertising and calls to the call center.
We used this data to conduct linear regression which allowed us to develop a function that can be used by the business to predict how many calls they will get for any level of advertising spend (within reason). This function was tested by making predictions for what the call volumes would be for advertising spends between $5000 and $7000, and then actually running the advertising while monitoring call volumes.
While it’s hard to predict human behavior with perfect accuracy and a certain amount of randomness is unavoidable, we found that our predictions were inline with what actually happened and this function is still being used by the business to make predictions about how much to spend on advertising based on how many trained call center staff the business has available.
Climate Change


Many businesses are becoming concerned about the impacts of climate change on their future profitability. In this case, a theme park operator wanted to understand how temperatures impacted attendance at one of their parks. Their concern is that increasing or decreasing average daily temperatures during the hottest and coldest months might reduce the number of monthly visitors.
To begin with, we took 11 months of attendance data (this park closes one month per year) and controlled for confounding variables, particularly holiday periods. We also collected local average monthly temperatures for corresponding periods. We then plotted this data and confirmed that in this location colder weather is associated with fewer visitors however the warmest weather does not create a disincentive. The relationship between temperature and visitors is positive and linear.
We created a function that allows temperature to be used to estimate the number of visitors and tested the predictions of this function against real attendance data focusing on months of the year as the key independent variable. As always, anything involving humans is subject to a certain amount of randomness, however, the function demonstrated solid predictive capability.
Given this geographic location tends to have temperatures that range from cold through to mild, the results were expected. It is also likely based on the data and the analysis that a slight warming of average temperatures in this area could actually increase the number of visitors to this park. However, any additional cooling in the colder months could be problematic for this theme park.
We believe it would be worthwhile rerunning this project at a similar theme park located in a much warmer area as we predict the data may reveal a trend that is opposite to the trend observed here and may suggest that additional warming could constitute a business risk.
Consumer Behavior


It’s always valuable for businesses to have some insights into which customers are most likely to complete a sale so they know who to devote their time to. This was a question for an Australian business that sells investment properties. After spending considerable time with each client they were faced with people who wanted, ‘to think about it’ and then disappeared and people who kept indefinitely postponing a buying decision because the time was never quite right. The biggest impediment though, was customers who were not able to get a loan to finance the purchase.
This business wanted to know if there was a way to predict which customers were likely to end up closing on an investment property based on simple information that could be gathered naturally in the first five minutes of a conversation. With that in mind, we used machine learning and data mining to look at 5 customer attributes: whether they were employed, what their occupation was, how long they had been in that occupation (less than 1 year, more than 1 year, more than 2 years, more than 5 years more than 10 years), relationship status and whether they still had children at home.
Not surprisingly, we found people who weren’t working (unemployed or retired) never closed on an investment property. However, we found that 95% of people who had been in their occupation more than 10 years closed on an investment property. Interestingly, we also found evidence that people in certain occupations including engineering and nursing are very likely to close, while people in other occupations including hospitality, childcare and retail are very unlikely to close. The chances of these people closing or not closing based on occupation does not appear to be influenced by other attributes at all. We suspect some, but not all, of the explanation is because occupation is often a good proxy for income which in turn is a major determinant of ability to obtain an investment loan.
While an encouraging start, we are cautious because this analysis was not conducted on a large data set and we have suggested revisiting this analysis at a later date when this business has had a chance to compile more data.
Political Campaigns

If you are contesting an election it is very helpful to know what people in the local community are concerned about. This dataset consists of the three biggest concerns (in no particular order) of 100 voters in an Australian State Electorate. We undertook data mining to identify associations hidden within the responses and uncovered two that had high confidence intervals (appeared a lot more than you would expect by chance). One association was between people concerned about aircraft noise and global warming and the other was between people concerned about the cost of car registration and the frequency of local busses.
What’s particularly interesting is that in the first example aircraft flight paths are the responsibility of the Commonwealth Government and in the second example local bus timetables are the responsibility of Council. However, this is very useful information for a candidate in a State Election. In the first instance, when a member of the community started expressing concern about aircraft noise, which the candidate could not make even the simplest of commitments about, they could be very confident if they segued into a conversation about their concern around global warming their remarks would resonate with the listener.
In the second instance, if a member of the community was unhappy about the cost of car registration (which the candidate’s party didn’t want to reduce), moving the conversation onto the failure of the local council to run more busses and promising to demand council improve the service if elected was likely to be a successful strategy in the majority of instances.
Value Adding
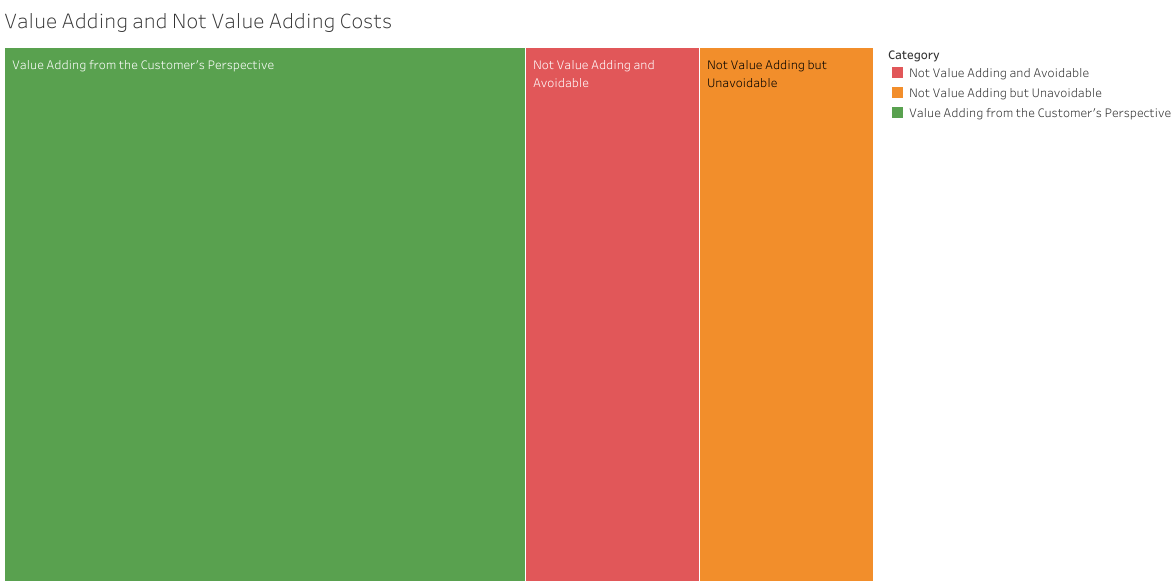
How much money could your organisation save if you cut out unnecessary activities that don’t add value from the customer’s perspective? Things like weekly meetings that could easily be replaced with an email. In the case of this organisation, they were able to reduce their costs by approximately 20% almost overnight!
Long Term Trends

A new security company needed to find a way to convince potential customers they solved a real problem, so we helped them use external longitudinal data to show prospective clients that property crimes were starting to increase in their area.
Call Centers

What do you do if your call center is always badly rated in customer satisfaction surveys? Our first step was surveying a selection of customers who had called the client’s company recently and asked them their three biggest issues with the experience. We also asked the team responsible for monitoring and scoring the quality of calls what they saw as the three biggest issues affecting customer experience.
We displayed the results to the organisation’s leadership team with a Venn Diagram. The results clearly show the quality team was not on the same page as the public. The quality team favored concentrating on problems that were budget neutral. However, customers wanted money to be spent on more staff, who were better trained and were empowered to make decisions and fix problems.
Branding


Often the same product can be offered to different target markets who buy it for different reasons. Take our client who started manufacturing a traditional Asian drink in Queensland that was distributed through stores across Brisbane. Initially, their branding was very basic and not targeted at any particular market. As the business grew, we helped them to use data to inform a branding project.
The client believed that there were two main target markets for their product. The first was Asian people who wanted a product they were familiar with, or people wanting a traditional Asian drink. The second was vegans who wanted another interesting vegan option that closely resembled a milk-based drink but contained no dairy.
We produced two versions of their bottles with different branding, targeting the two groups. We then conducted split testing by introducing the bottles into the existing distribution network and monitoring sales at the retails outlets in each suburb to establish sales volumes for each branding at each location.
We discovered that in some locations, particularly around the city, sales remained quite consistent regardless of the branding. However, in some suburbs the branding had a very large impact on sales volumes with some suburbs demonstrating a clear preference for one branding strategy over the other. We also found a north/south divide, with a clear preference for branding relating to the traditional nature of the drink south of the city and a clear preference for branding relating to the vegan credentials of the drink north of the city.
Ultimately the client selected a strategy that used both brands and optimised the number of bottles with each branding distributed to each area in proportion to the preference for a particular brand in that area.
Investment Decisions


Growing businesses often have to decide between investment decisions. In this case, the business is a holding company that buys restaurants that it believes it can add value to and operate profitably. Using one of our custom-made in-house applications, we helped them assess two alternatives they were considering. One was a traditional restaurant and the other was something new for them; a food truck.
We asked them to provide their estimates of the expected, best case and worst case income and expenses per year over the next 10 years. We then calculated what the total profit of each scenario, for each option, would generate over the 10 year period in today’s dollars.
In either option, the worst case scenarios would loose the business a substantial amount of money. The best case scenario in either option would of course make the business money. The most interesting observation to come out of this analysis however, is the fact that even though it was by far the lower cost option to own and run (therefore lower risk), under the expected scenario the food truck would actually deliver a higher net present value of cashflows than the traditional restaurant. Under the best case scenario the restaurant outperformed the food truck, but only by approximately 12%.
Ultimately the food truck also provided an acceptable yearly return on investment under both the expected and best case scenarios while the restaurant did not. The cumulative weight of the evidence led the company to make a decision to venture into unknown territory with their first food truck acquisition.
Speed Cameras

We don’t encourage speeding, but if you have staff who drive all over a major city for work it’s helpful to keep track of where all the speed cameras are currently located.